The Problem
Problem The Web3 space has a big problem with too much data. Every second, countless trades happen on the blockchain. But for normal users and traders, looking at raw crypto data is just confusing. It looks like a giant wall of numbers. The real issue is figuring out what those numbers actually mean. Most crypto tools today have two big flaws. They are either too slow because they need humans to read them, or they do not show you how they get their answers. By the time you spot a big wallet moving money, the chance to act is already gone. Users need a clear and fast way to see what is really happening in the market.
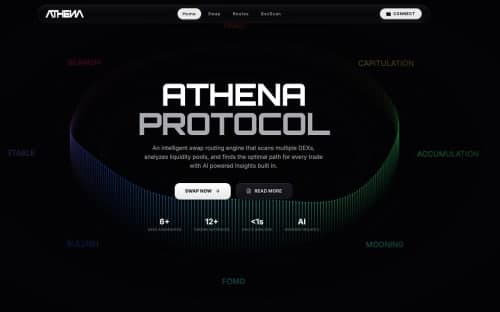
The Solution
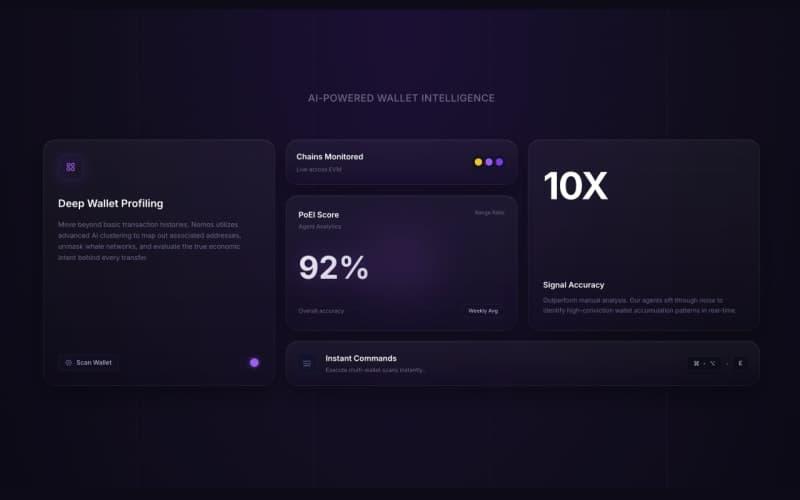
Nomos fixes this problem completely. It is a smart Web3 dashboard that turns confusing crypto numbers into clear market signals. To do this, Nomos uses AI tools to watch the blockchain live. These AI tools track wallets and spot big money moves instantly. My job was to take all this complex data and make it look beautiful and simple. I designed a premium UI and UX that anyone can understand. The best part is the clear tracking. Every time the dashboard shows a signal, it tells you exactly which AI tool found it and what blockchain data caused it. Using modern web tools like Next JS, we made an easy to use platform that gives users a clear edge in the crypto world.
Showcases
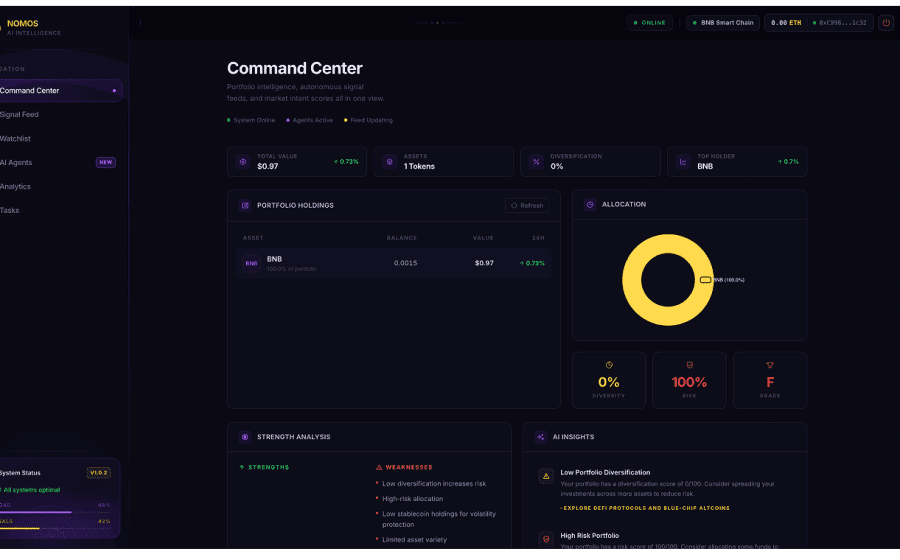
Command Center Dashboard Overview
The main dashboard screen of the Nomos platform is designed with a dark luxury theme to make reading data easy on the eyes. The screen gives a complete summary of a user portfolio. You can see the total value, how many assets are held, and the overall diversification percentage. A bright yellow circle chart clearly shows that the portfolio is heavily focused on just one token, which is BNB. Because of this, the dashboard gives the portfolio a risk grade of F and a diversity score of zero. Below the chart, the AI steps in to help. It lists exact weaknesses, like having too much risk, and provides clear insights. The AI suggests adding stable coins to balance the portfolio. On the left side, a clear navigation menu lets users easily move to different parts of the app.
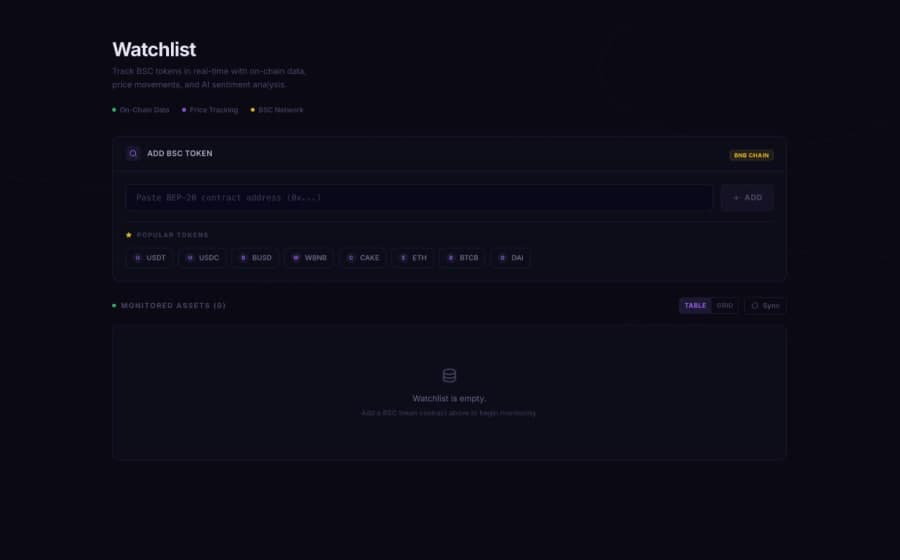
Custom Token Watchlist
A clean and simple tool for tracking specific crypto tokens on the Binance Smart Chain. The layout is very straightforward. At the top, there is a large search bar where users can paste a specific smart contract address to add a new token to their list. Right below the search bar, the app suggests popular tokens to add quickly, such as USDT, WBNB, and Ethereum. The bottom section is currently empty, prompting the user to start building their custom list. This screen is perfect for users who want to keep a close eye on their favorite Web3 assets. The interface includes options to view the monitored assets in a table or a grid format once they are added.
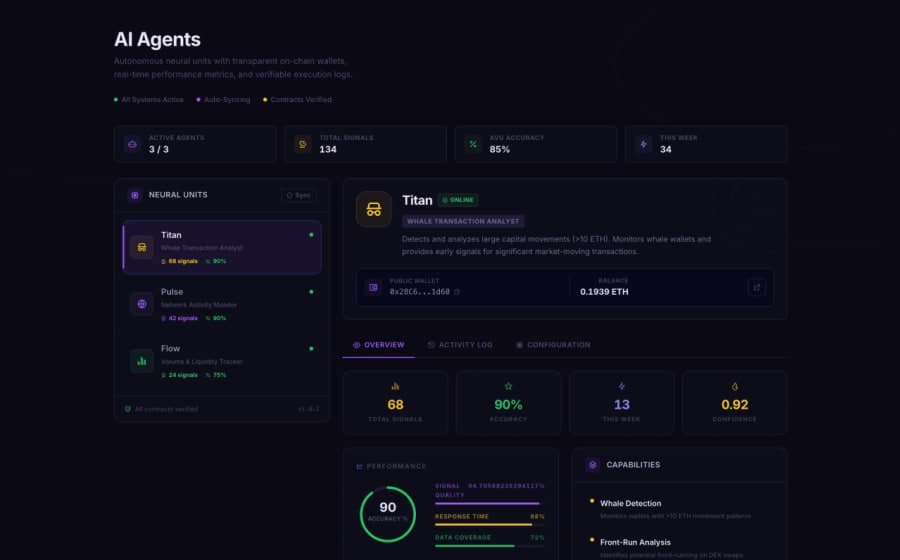
Autonomous AI Agents Hub
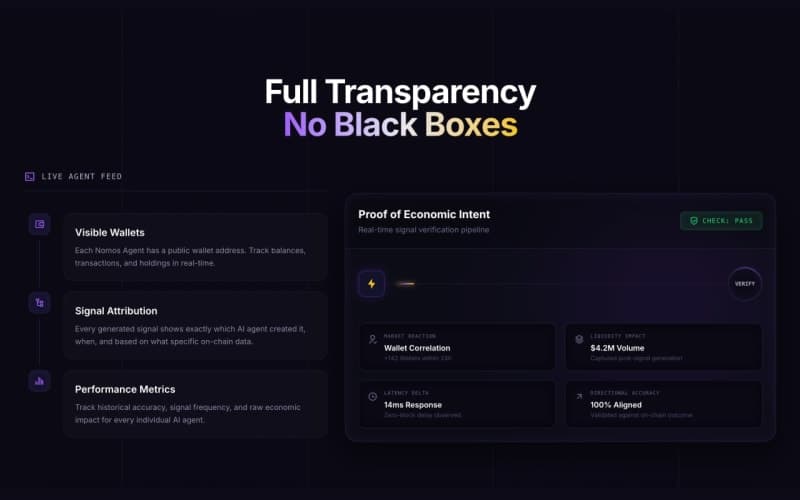
The brain of the Nomos platform introduces the different AI agents that work behind the scenes to track the blockchain. The interface lists active neural units like Titan, Pulse, and Flow. Each agent has a specific job. For example, Titan is the Whale Transaction Analyst. The interface provides full transparency by showing the exact public wallet address and current Ethereum balance for Titan. Below this, users can see a detailed performance report. It shows that Titan has a ninety percent accuracy rate and has generated sixty eight total market signals. The design uses soft green colors to show that the system is online and doing well. It clearly explains what the AI can do, like detecting big money movements before they happen.
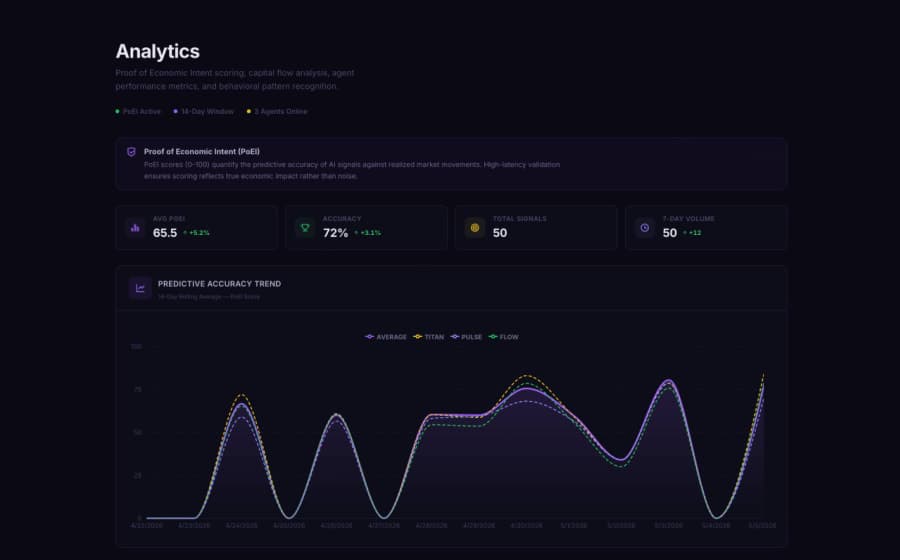
Market Analytics and Predictive Scoring
A beautiful and complex data visualization section focuses on the Proof of Economic Intent scoring system. The main element is a large flowing line graph that tracks the predictive accuracy of the AI agents over a fourteen day period. Different colored lines represent different agents, like Titan and Pulse, along with the overall average score. Above the graph, quick stats give users a fast update. It shows an average score of sixty five and a total accuracy of seventy two percent. The dark background makes the purple, green, and yellow graph lines pop out. This color contrast makes it very easy for users to read market trends and see how well the AI is performing over time.
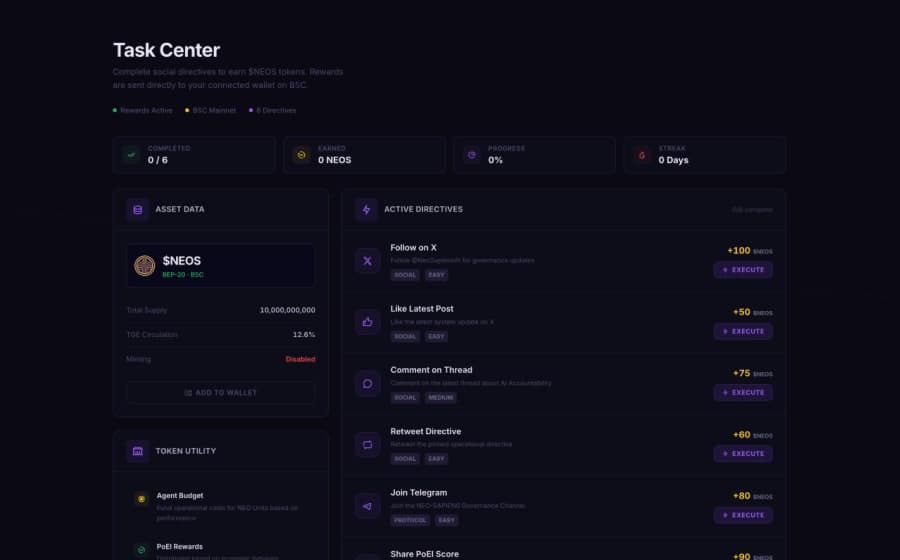
Web3 Task Center and Rewards
The Task Center is where users can earn crypto tokens by completing simple community actions. The design is clean and focuses on getting things done. At the top, users can track their completed tasks, the total NEOS tokens they have earned, and their daily streak. The main area lists active directives. These are simple social tasks like following a page, liking a post, or joining a Telegram group. Next to each task, users can see exactly how many tokens they will get, such as plus one hundred NEOS. On the left side, there is an asset data card that shows the total supply of the NEOS token on the Binance Smart Chain. It even includes a quick button to easily add the token to a Web3 wallet.
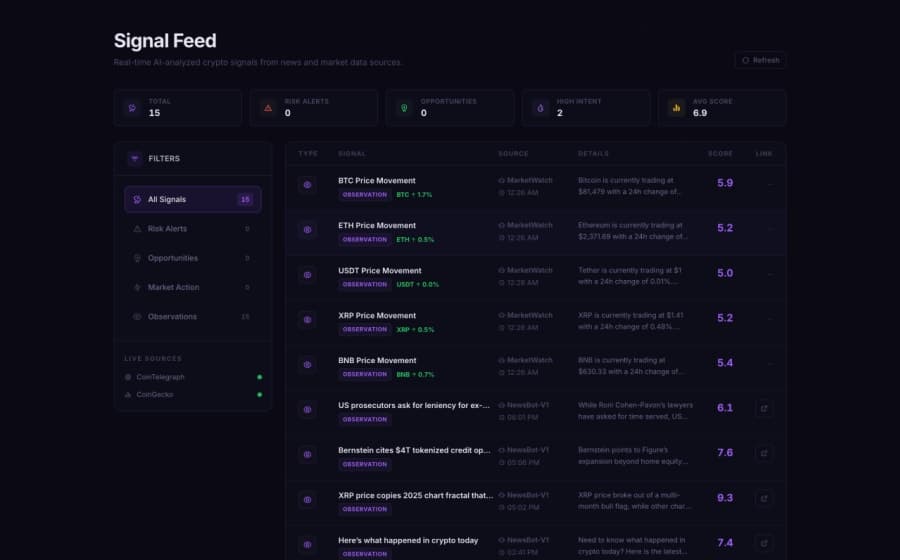
Real Time Market Signal Feed
The live feed of crypto market signals looks like a highly organized news feed built for traders. At the very top, summary cards show the total number of active signals, risk alerts, and high intent opportunities. The main section is a detailed table listing the latest market observations. Each row tells you the type of signal, the specific token like Bitcoin or Ethereum, the source of the news, and a brief summary of what is happening. Each signal also receives an AI score to tell you how important it is. A sidebar on the left lets users easily filter the feed so they only see the news they care about. The layout keeps a massive amount of market data organized and extremely easy to read.
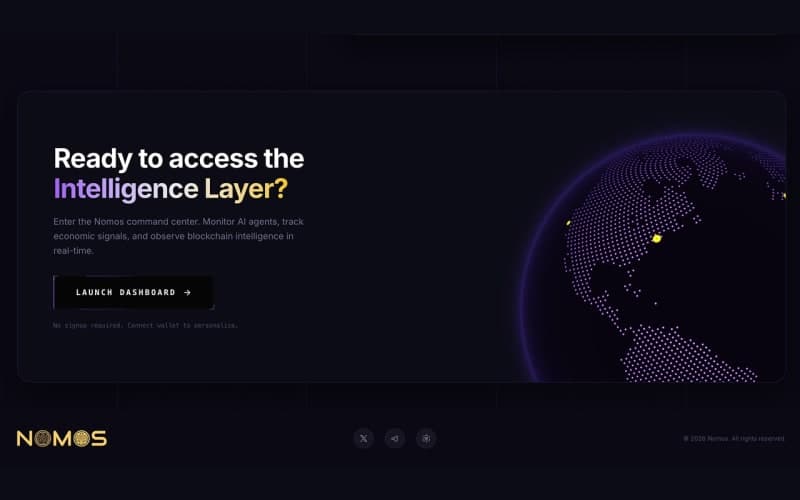
Nomos is a smart Web3 platform built to help crypto users make better choices. It uses artificial intelligence to read the blockchain in real time. Instead of looking at confusing charts, users get a clear, premium dashboard that tells them exactly what is happening in the market. The design features a dark, luxury layout that makes complex data look beautiful and easy to read.
How Nomos Works
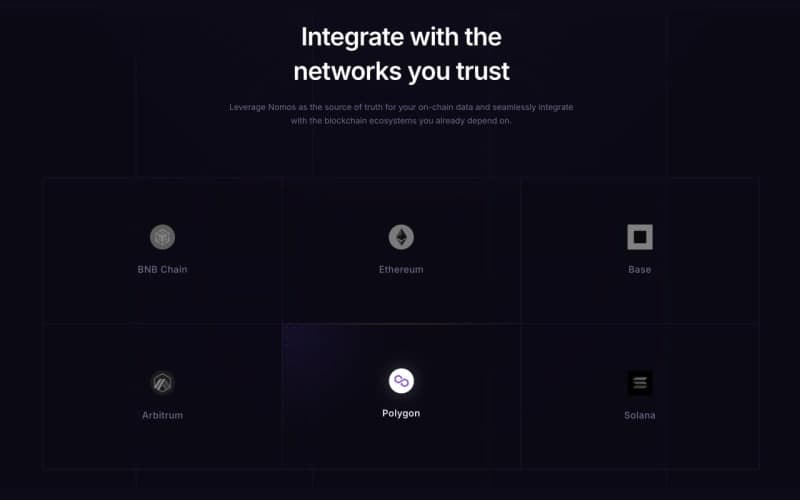
The system connects directly to your Web3 wallet. For this project, it tracks networks like the BNB Smart Chain. Once connected, Nomos runs a full scan of your assets. At the same time, smart AI tools are always watching the wider crypto market. They look for big money moves, market trends, and risk levels. Then, they put all this data into simple scores and clear alerts right on your screen.
Core Dashboard Features
The Command Center This is the main screen where all the magic happens. It gives you a complete view of your portfolio health, live signal feeds, and market scores. The system is always online and updating, showing you exact details like the current AI system load so you know the data is fresh.
Deep Portfolio Analytics Nomos looks closely at what you own. For example, if a user holds only one token like BNB, the system will show a risk grade of F. It tells you your diversification is at zero percent and clearly points out your weak spots, such as having a high risk setup with limited asset variety.
Smart AI Insights The platform does not just show your balance. It gives you direct, helpful advice.
- If your risk is too high, the AI will suggest adding stable coins like USDC or DAI to protect your money.
- If you have too much of one token, it will advise you to spread your investments to lower your risk.
- It helps you explore safe DeFi protocols to grow your portfolio safely.
Live Economic Signal Feed
Nomos uses named AI tools to watch different parts of the market. They work in the background and post live updates to your dashboard. Here is an example of what the live feed looks like:
| AI Agent | Signal Type | Market Alert Details | Threat Score |
|---|---|---|---|
| TITAN | Risk | High trading volume detected across major exchanges. Caution advised for BTC. | 8.5 |
| PULSE | Opportunity | Strong positive sentiment on Layer 2 networks. Entry window opening. | 7.2 |
| ATLAS | Observation | Stable coin dominance is rising. Market is showing caution. | 5.0 |
Market Intent Scores To make things even easier, Nomos gives the whole crypto market a simple number score. It scores the overall Market Sentiment, Risk Level, and Opportunity Index. This helps users know if it is a good time to buy, sell, or just wait. By using modern web tools and a clean user interface, Nomos turns raw data into a clear advantage for any user.
Screenshots